There are several simple steps to start using the Simple Charts for Confluence addon.
Feel free to review the https://stepashka.atlassian.net/wiki/pages/resumedraft.action?draftId=1319043080 page to see the real life usage examples of the addon.
Installation
Make sure you’ve installed the addon. Please follow the instructions from Installation page.
Data table
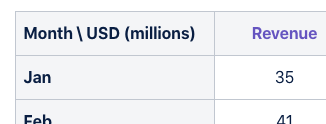
There should be existent data table on the page or the new data table should be created. Data table should follow a following convention:
First row should contain data set names. First row should be marked as table header. Color of the header’s text will be used on the chart.
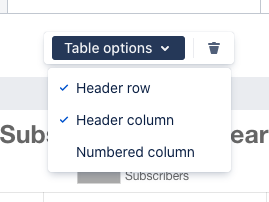
First cell of first row can contain horizontal and/or vertical axis names. These should be split by \ .
Widget addition
Widget should be added above the data table. There should be no other tables in-between but other elements are allowed.
Widget can be added by typing / or using the Insert option from menu.
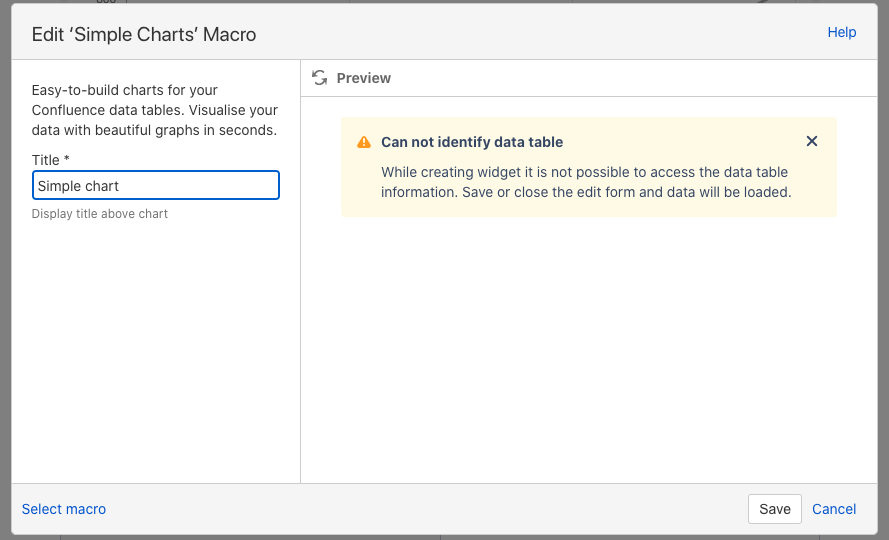
There is only one option to be configured: widget title. Rest of the configurations is read from the data table.
Some known issues
Because of the way Confluence works it is not possible to show the graph preview in the widget configuration pop up. Warning message with the explanation will be displayed.
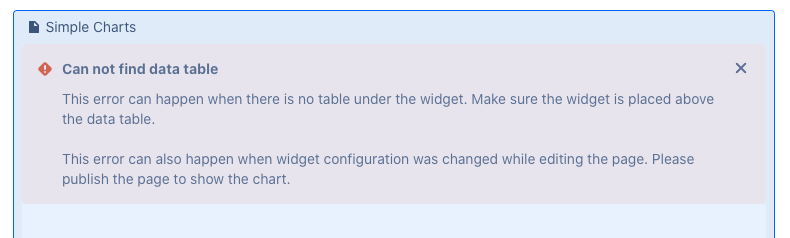
Sometimes after widget configuration changes it is not possible to get content of the data table. Warning message with instructions will be show. Page need to be published to resolve the issue.